

Want to know what your visitors are up to on your WordPress site? Well, buckle up because we’re about to dive into the world of heat maps. These handy tools give you a visual snapshot of user behaviour, and today, I’ll walk you through how to add heat maps to your website. Let’s get started!
This post contains affiliate links. If you buy through these links I will get a small commission at no extra cost to you. I only recommend products that I use and love or products that I want to try.
Estimated reading time: 8 minutes
What are heat maps?
Heatmaps aren’t just for weather reports!
A website heatmap is like a cool visual snapshot of how people use a website. It’s like seeing which parts of a webpage get all the love and attention and which parts don’t.
Basically, it uses colours to show where visitors click, scroll and move their mouse the most. The hot spots are all fiery red or orange, while the not-so-hot spots are more chilled out with blues and greens.
By checking out a website heatmap, you can figure out the trends, like what people are really into and what they’re not quite so into.
This helps you tweak things, like the layout, design, and where you put stuff, to make the website super user-friendly and boost conversions.
Heat map tools
There are a few different heatmapping tools around. The one I’ve been using is called Hotjar. FYI – I’m still using the free account at the moment.
I started using it because it was the first non-sponsored search result when I Googled ‘heatmaps for website’. And I like using it, so haven’t felt the need to find an alternative. If it’s not broken, don’t fix it – am I right?
What I like about HotJar is that I don’t just get heat maps. I also get anonymous recordings of users mouse movements on my site. So I can not only see where their mouse spends the most time, but I can see how it got there too.
Hotjar heat maps
Before you start thinking about adding Hotjar heat maps to your site you’ll need to create a Hotjar account.
They’ve got a free plan, but if you want some extra goodies, consider going for a paid plan. Once you’re signed up, they’ll give you a special tracking code just for your Hotjar account.
Set up your Hotjar Account
To add heat maps to your website you’ll need to set up a Hotjar account. These instructions are really detailed and cover a range of scenarios.
Add heat maps to your website via plugin
Install the Hotjar plugin
Time to jump into your WordPress dashboard! Click the “Plugins” option and then “Add New.” Search for the official Hotjar plugin and hit that install button. Don’t forget to activate it too!
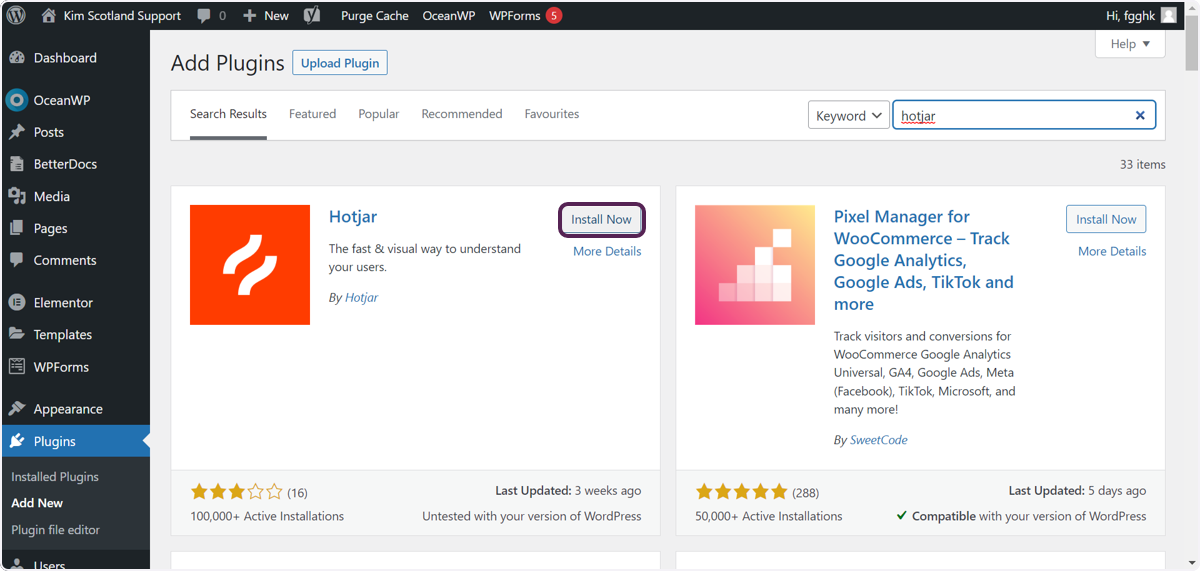
Configure the Hotjar plugin
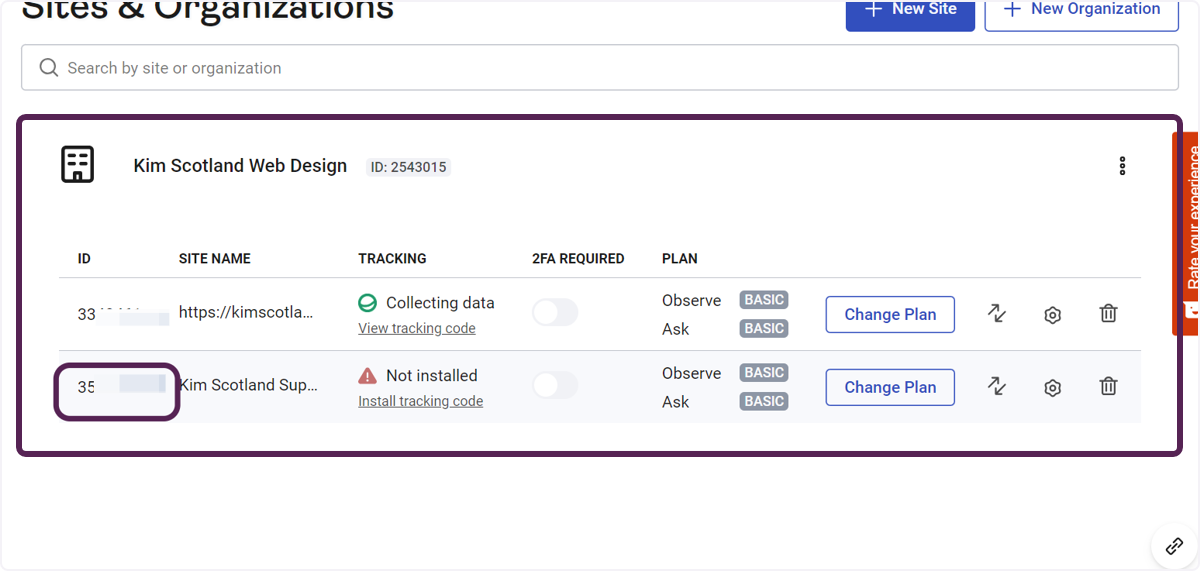
Head into Hotjar and find your Site ID.
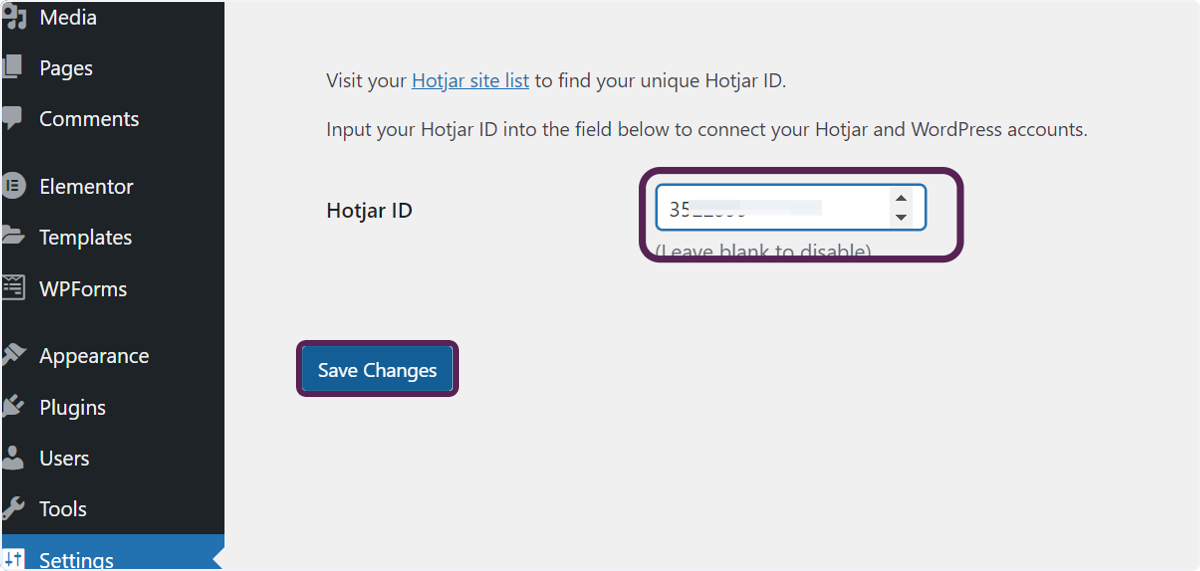
Click the “Settings” option in your WordPress dashboard and click on “Hotjar.”
Look for the spot where they ask for your Hotjar tracking code.
Copy and paste that code you got from your Hotjar account right in there. Don’t forget to save your changes!
Verify installation
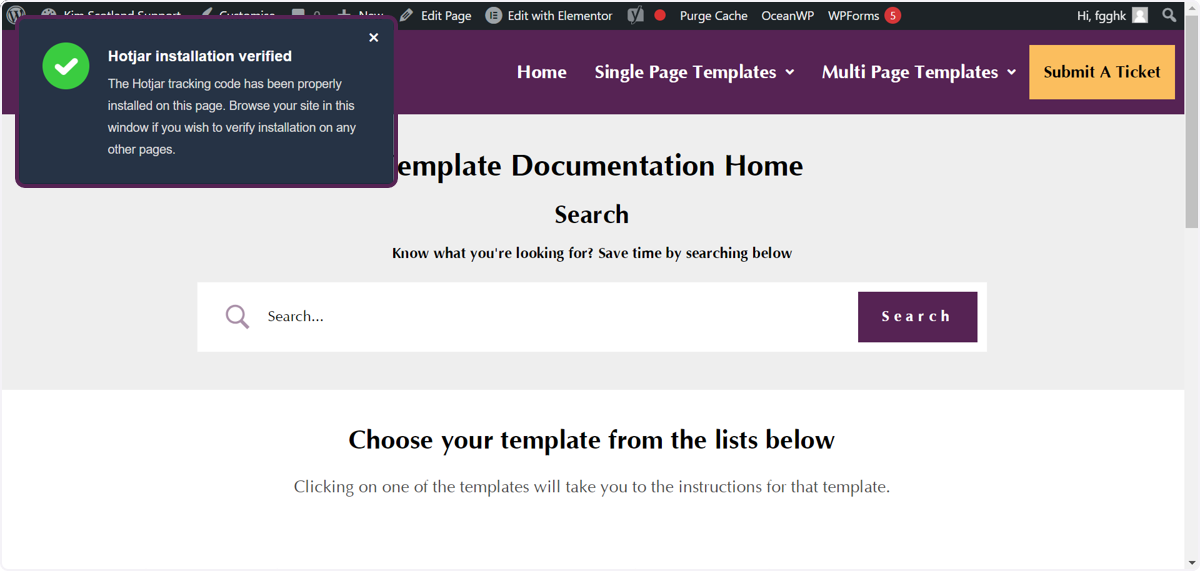
We want to make sure Hotjar is playing nicely with your website, so click on the “Verify Installation.” link that appears in WordPress.
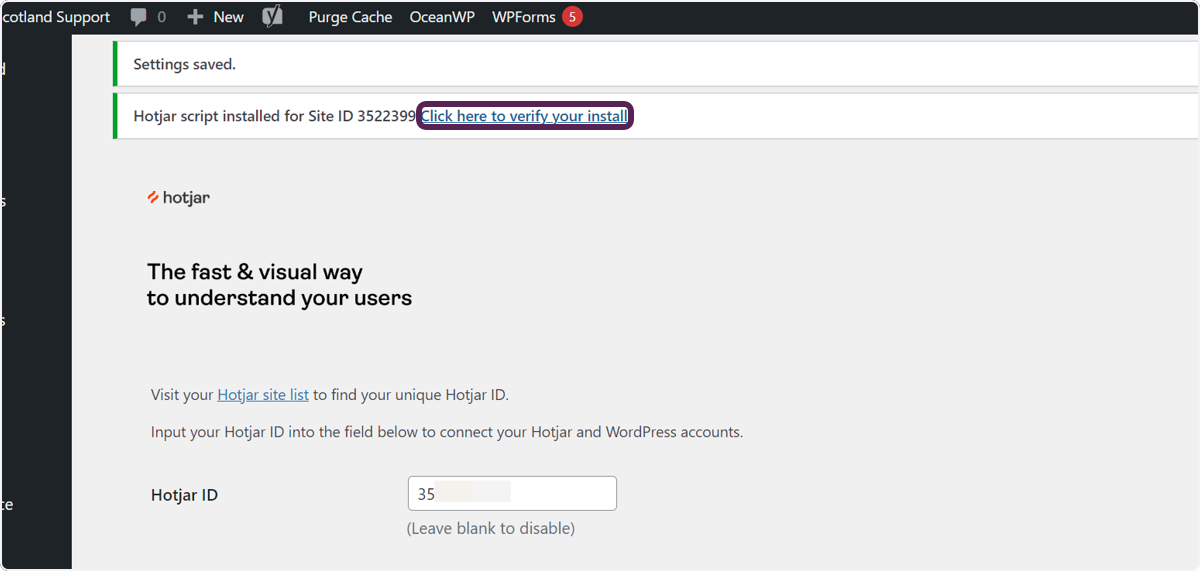
Hotjar will open the site in a new tab and if it’s all good, you’ll get a nice confirmation message.
Add heat maps to your website via code
If you’re not familiar or comfortable writing code I recommend that you do this via a plugin.
I get that it’s another plugin and we want to keep them to a minimum, but a plugin that allows you to add code to certain parts of your website will be useful for more than just adding heatmaps.
If you want to add a Facebook pixel, link your site to MailerLite or even Google Analytics, you can do all of those things by adding code to your website header. A single plugin like WP Code Lite (free) will allow you to do all of those things in one single plugin.
Get your tracking code
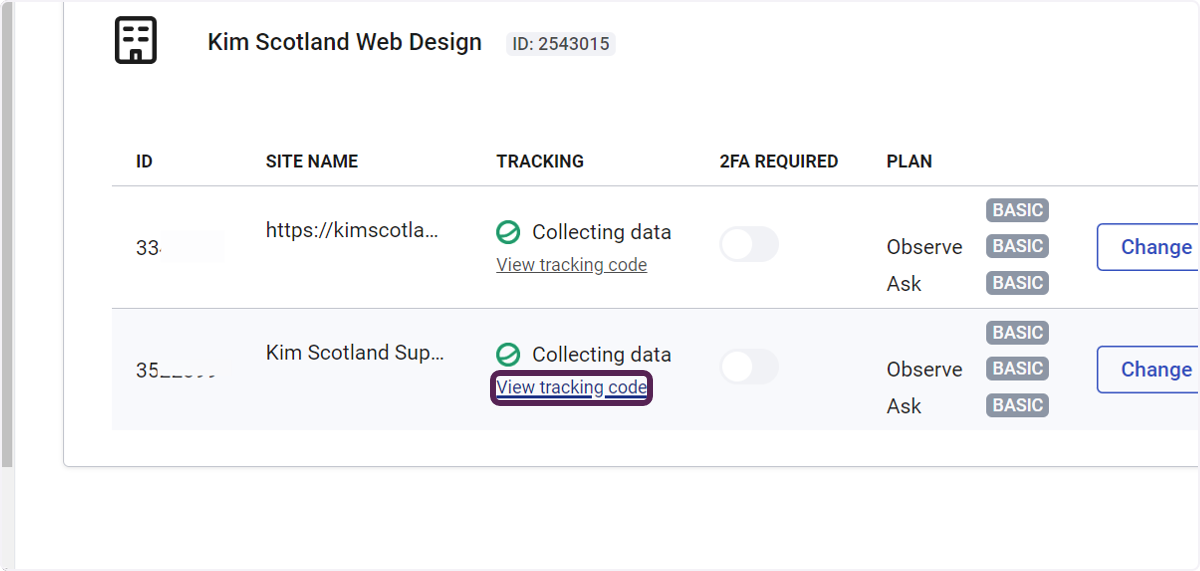
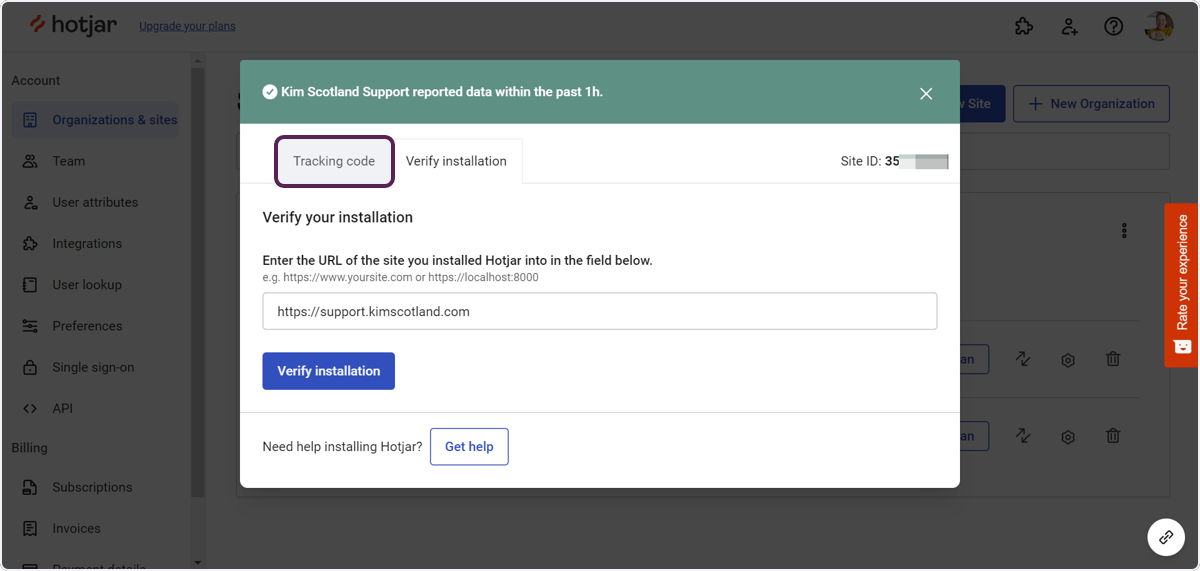
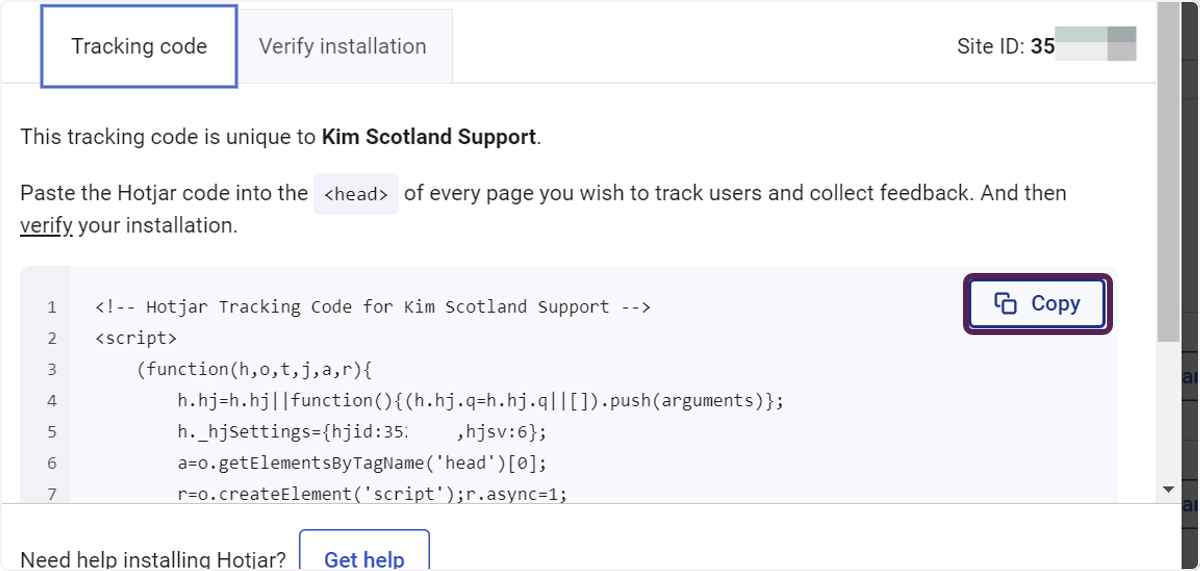
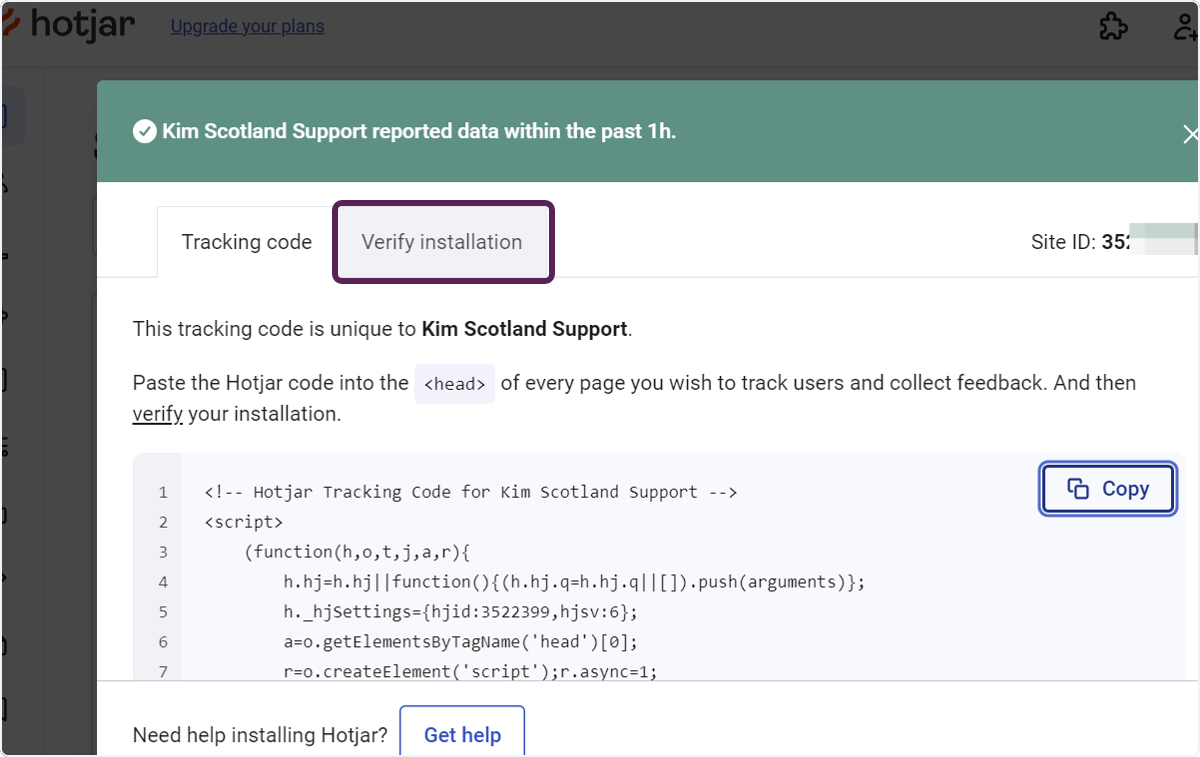
Go to your sites page within Hotjar. Click on the ‘Install tracking code’ link for the site you want to track. Then click Copy to copy the tracking code.
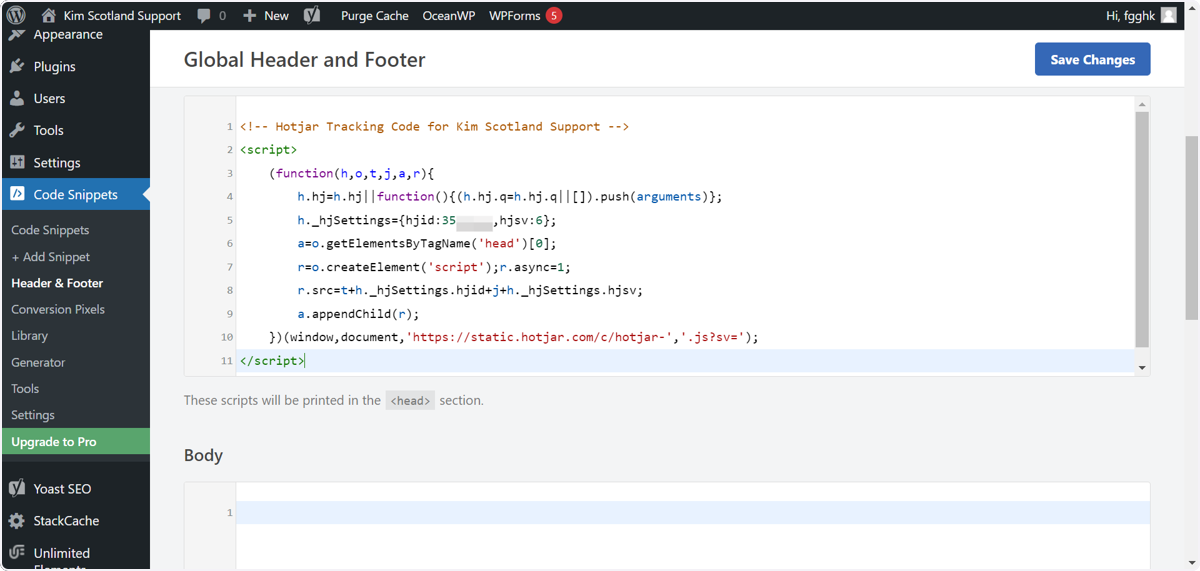
Add the code to your website
Go to WP Code Lite and paste the code into the header section and click Save Changes.
Verify the installation
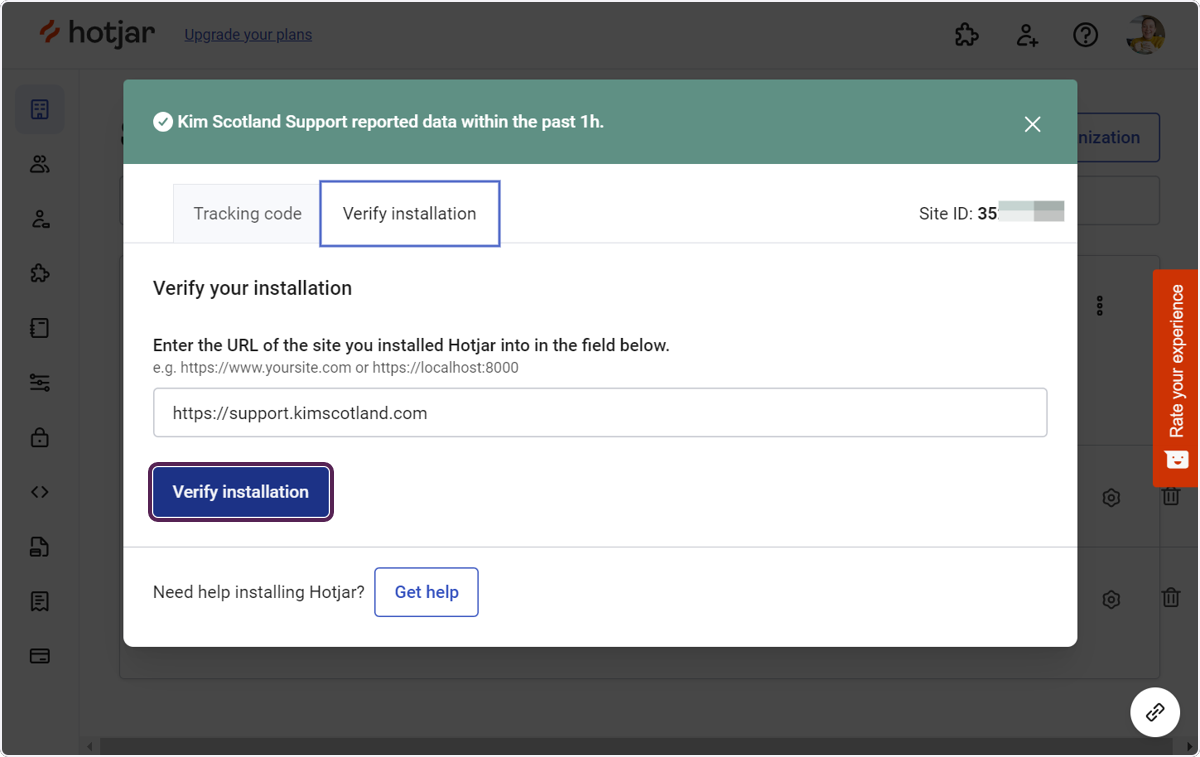
Head back into Hotjar to make sure that the installation is working. Click the Verify installation tab, then click the Verify Information button.
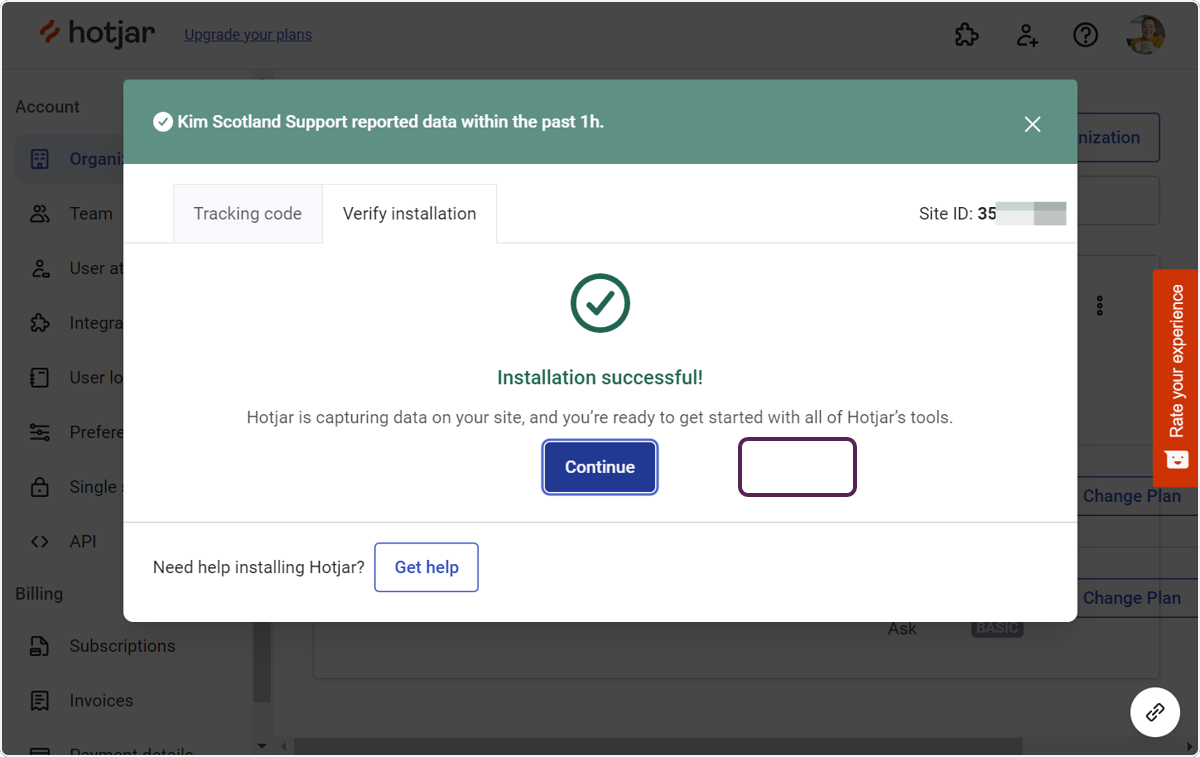
You should get a confirmation message to say that your site has been verified.
If you’re having any trouble with it tracking, check out how to check that Hotjar is working and troubleshooting FAQs for tracking code installation.
Analyse your heat map data
Now it’s time for the juicy part.
Hotjar will start gathering user behaviour data on your website once you’ve enabled heat maps.
Give it a little time to collect enough data, and then head back to your Hotjar account.
Find the “Heatmaps” tab, select the heat map you want to check out, and voila!
Hotjar offers different types of heat maps, like click maps, scroll maps, and move maps.
Each one gives you unique insights into how users interact with your site.
Add heat maps to your website: a step by step guide: summary
Now that you know how to add heat maps to your website, you’ll be able to unlock a whole new level of understanding user behaviour.
With our step-by-step guide, you’ll breeze through the process, whether you choose to use a plugin or add the code straight to your site, and gain valuable insights to supercharge your site’s performance and user experience.
Get ready to make your website sizzle with Hotjar’s heat maps and take your optimization game to the next level. Happy tracking!
You may also enjoy
How website heat maps can boost your business
Why track website visits? 5 key benefits for small business
How to connect Monster Insights to Google Analytics